My name is Karin Lehnigk (which is pronounced "LEN-nick"). I study how landscapes have changed over time, to predict how they might change in the future. Geomorphic processes such as floods, landslides, or plants and animals doing their thing can change topography. But topography also controls how and where these processes take place. The connections between topography and surface processes are complicated, but can help us learn why landscapes look the way they do and identify potential risks from future changes.
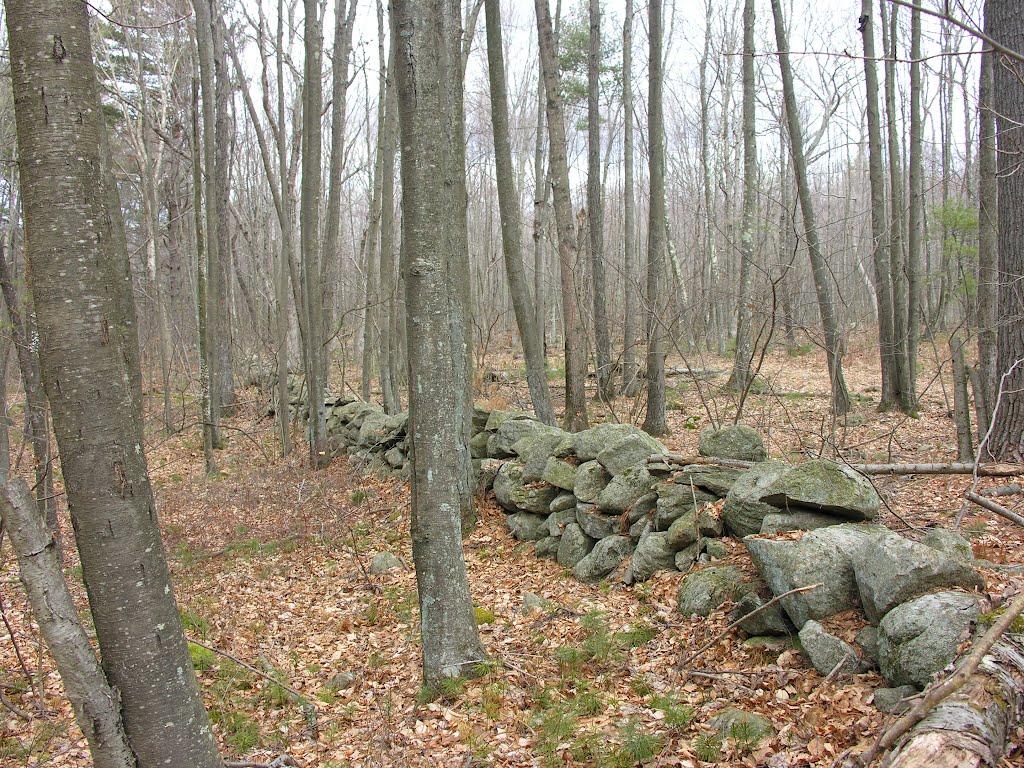
The stone walls found all over New England are one of my favorite ways to reveal what's going on in the landscape. European colonists built these to get rid of the massive boulders in the glacial till they tried to farm. They stand out really well on LiDAR imagery!
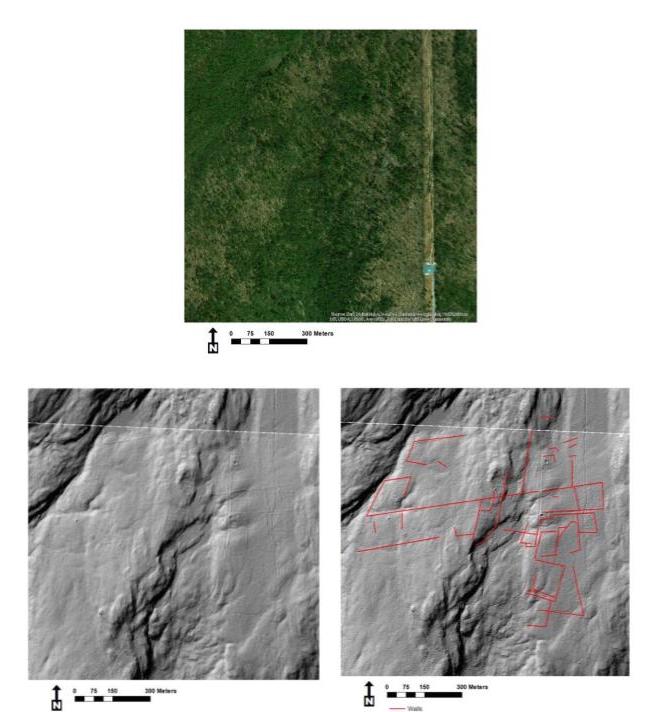
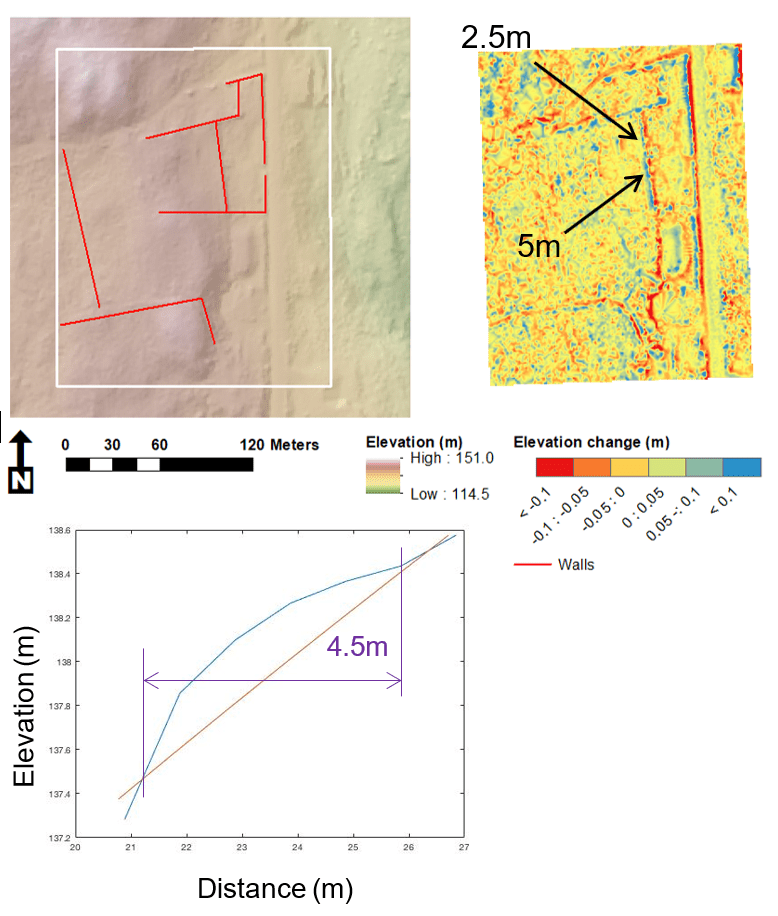
Often it can be tricky (and expensive!) to find ages and rates of hillslope processes, but since the walls were built by people, we can sometimes find construction ages in historical records, and use those ages along with the hillslope morphology (fancy word for shape) to estimate how fast the soil has been moving downhill.
With our ballpark diffusivity, we could apply it to a bigger 2D landscape and see how well our model performs. Using the topography around the wall, I ran the model for 238 years--the same age as the wall--and looked at the elevation differences afterwards. Sediment builds up on the uphill side of the wall to form a pile about the same size as the one we measured; cool!
The construction of the walls corresponds with some major landscape changes associated with European settlement, such as widespread clear-cutting, construction of dams and millponds, and plow-based agriculture. We can compare our erosion rates with estimates over a longer time period to see how these changes stack up against changes caused by climate or tectonics, or how similar they are to other landscapes around the world. Or consider how differences in surface materials might change the hillslope diffusivity, and the role human activities have played in shaping that. Once you start thinking about the hidden information in landscapes there's no going back!